

Background Paper No. 15
BY Shayak Sengupta

Summary
The price of solar energy has plummeted over the last decade in large part due to the reduction in manufacturing costs of solar photovoltaic (PV) technologies. The People’s Republic of China has been instrumental in realizing these reductions through industrial policy to expand solar PV manufacturing capacity. However, increasing market concentration has accompanied this expansion. Eighty to ninety percent of solar PV production capacity is housed in China, with some segments heavily concentrated in certain regions, companies, or single facilities. Several other economies seek to grow their share of solar PV manufacturing to mitigate the risks of a heavily concentrated supply chain. Energy security, domestic employment, geopolitical interests, human rights concerns, and decarbonization motivate these efforts. This analysis presents a first order estimate of solar PV manufacturing costs associated with diversified supply chains. It analyzes both domestically integrated supply chains and combinations of countries for internationally integrated supply chains with trade. It finds that absent subsidies, solar PV manufacturing costs using diffuse, diversified supply chains outside China and Southeast Asia will cost approximately 30% more, but there is wide uncertainty in the increased cost due to variations between economies. Manufacturing subsidies or import tariffs offered by national governments can reduce this gap, but decisionmakers should consider this as an increased cost associated with actions to reduce supply chain risk from concentration. Consequently, states must cooperate to coordinate finance, subsidies, incentives, and trade barriers for solar PV manufacturing. This international cooperation is essential to diversify supply chains so that it will minimize increased costs, leverage scale, and increase innovation and resilience while reducing market uncertainty.
Introduction
The price of solar energy has plummeted over the last decade in large part due to the drop in manufacturing costs of solar photovoltaic (PV) technologies. Since 2009, the costs of manufacturing solar panels have decreased by about 90% due to increased efficiencies, economies of scale, and reduction in labor costs. These costs reductions are a boon for the uptake of solar energy to meet both energy demand and climate goals by decarbonizing electricity systems.
China has been instrumental in realizing these reductions through industrial policy that has expanded capacity to manufacture silicon solar PV, the main solar PV technology. However, increasing market concentration has accompanied this expansion. Depending on the segment of the solar PV supply chain, 75-97% of production capacity is housed in China, with some segments heavily concentrated in certain regions, companies, or single facilities. Concentration of supply chains in China extends beyond solar PV to other clean energy sectors such as battery electric vehicles, and China is also a major supplier in the wind energy and clean hydrogen sectors. Given the undergoing energy transition, any supply chain concentrated to this degree brings vulnerabilities from potential shocks.
Like-minded countries consequently look to reduce the risks from such concentration. National governments have taken efforts to spur domestic manufacturing of solar PV to reduce supply chain dependencies. In addition to energy security, several factors drive these efforts: decarbonization of electricity systems with solar energy, domestic employment creation from added manufacturing, geopolitical interests to increase domestic economic competitiveness, and human rights concerns from forced labor in solar PV manufacturing in the Xinjiang province of China.
Governments have largely operated in silos in their efforts to spur domestic manufacturing of solar PV to reduce concentrations, centering efforts on a combination of domestic subsidies and imposition of tariffs against imported solar components. However, analysts lack first-order estimates of what diversified internationally integrated solar PV manufacturing would cost. While such estimates exist for fully domestic solar PV supply chains to inform domestic policies, information about how costs would differ if states linked together to realize dispersed, diversified supply chains is not available.
This analysis first presents an overview of the solar PV manufacturing supply chain, followed by a framework to analyze costs of various economies linking to manufacture each part of the chain. It then models estimated costs associated with fully domestic, integrated supply chains in nine economies: Brazil, China, India, Germany, Malaysia, Philippines, South Korea, Taiwan, and the United States. It groups China along with Malaysia and the Philippines as representative countries for Southeast Asia. This reflects the substantial Chinese investment in this region in solar manufacturing. Next, the analysis estimates the costs of the diversified supply chains with different combinations of these economies manufacturing each step. Drawing from this modeling and analysis, conclusions and recommendations are put forward based on the costs of pursuing these diversified supply chains.
Steps in manufacturing solar photovoltaics
Figure 1. The major steps of the crystalline silicon-based solar photovoltaic supply chain.
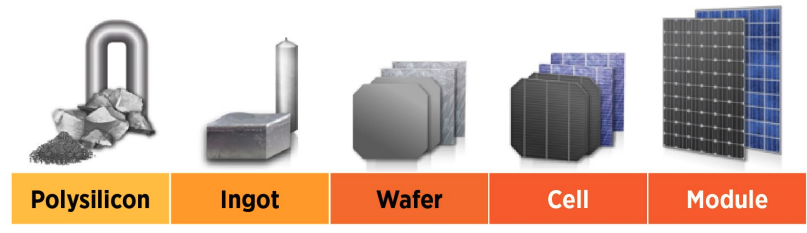
Source: U.S. Department of Energy (2022)
There are four major steps in the manufacturing of crystalline polysilicon (c-Si) solar photovoltaic panels, the most popular technology to harness solar energy at 95% market share (Figure 1).
The first step refines metallurgical grade silicon to remove impurities. Metallurgical grade silicon comes from mined quartz rock heated with coal or charcoal.
The second step makes ingots and wafers by isolating the refined polysilicon, melting it into large ingots, and then cutting the ingots into thin wafers.
Then in the third step, the wafers are combined with other metals and chemicals to produce a cell.
Finally, the fourth step assembles a solar module by combining cells and attaching them with glass and metal.
In each step, China dominates global manufacturing capacity by nearing or exceeding 80%, with shares in the wafer step exceeding 90%.
Quantifying the costs of diversified solar supply chains
Figure 2. Analysis framework to quantify supply chain costs.

This analysis first finds all possible combinations of economies in each step of the solar PV manufacturing supply chain. It then quantifies the cost of production of each step located in each economy, assuming inputs from the preceding step. Source: Author’s analysis.
To quantify the short-term unit costs of a diversified solar supply chain, this analysis first models all combinations of nine economies: Brazil, China, India, Germany, Malaysia, Philippines, South Korea, Taiwan, and the United States participating in each of the four steps in the solar supply chain (Figure 1). It then explores the associated costs of internationally traded supply chains by quantifying the costs of every combination of economies in each step. Appendix I lists the main assumptions used to calculate these costs mainly derived from Woodhouse et al. (2020) and Shiradkar et al. (2022) which use 2018 values. Because there are nine possible destinations of manufacturing in each step, this analysis quantifies the manufacturing costs of 6,561 hypothetical supply chains. For example, polysilicon can be manufactured in China, sent to India for ingot and wafer manufacturing, then the wafers sent to Germany for cell production, and finally the cells assembled into the modules in the United States. Likewise, if all four major steps of the supply chain occur within the same territory, then the supply chain is fully integrated domestically (Figure 2). Importantly, this analysis does not consider any present subsidies or incentives offered by national governments for cost reductions, nor any tariffs to inhibit the trade of inputs between each segment of the solar PV supply chain. This is intended in order to focus on the structural reasons underlying differences in solar PV manufacturing costs between countries.
Fully domestic, integrated solar supply chains will be very costly for some countries absent subsidies
Absent subsidies, fully integrating domestic supply chains of solar photovoltaics will come at substantial cost to some economies (Figure 3). China and Southeast Asia remain the most cost competitive reflecting the current concentration of solar PV manufacturing in these regions. On a U.S. dollar per watt ($/W) of finished output basis (i.e. materials and inputs needed for one watt of solar generating capacity) estimated manufacturing cost varies by up to 54% between the between the least expensive (Malaysia) and most expensive (Germany). When accounting for higher or lower assumptions of costs of manufacturing inputs, the relative difference between countries is even higher, with the difference between the least and most expensive countries differing by over a factor of two.
There are three groups of economies in terms of estimated costs: low, middle, and high. Estimated manufacturing of produced solar PV capacity, or $/W, of integrated manufacturing are least in Malaysia, Philippines, and China ranging between $0.38/W to $0.41/W. These costs include depreciation for initial capital investment, which are likely zero, given the current market share for manufacturers in these regions. The middle group: Taiwan, India, and South Korea, have costs about 20% higher between $0.43/W to $0.49/W. Lastly, the United States, Brazil, and Germany are in the high group. They see the highest costs of domestically integrated manufacturing: about 40% more than low-cost economies, $0.52/W to $0.59/W of produced solar PV capacity.
Differences in cost of labor, electricity, and interest burden drive the difference between these estimated costs. Overhead costs and profit margins, which are a percentage of total cost, further compound these differences. We note estimates are more than previous analyses due to assumptions of higher input costs, mainly using higher 2018 values instead of 2022 or 2023 values due to data limitations. For example, without profit margin, the International Energy Agency estimates costs in China to be about $0.24/W in 2022 comparable to this analysis’ estimate of $0.33/W which match 2018 estimates from the U.S. National Renewable Energy Laboratory. More importantly, the relative differences in estimated costs between countries in this analysis are similar to previously published analyses.
Figure 3. The costs of fully integrated, domestic solar supply chains

Absent subsidies, fully integrated domestic supply chains of solar photovoltaics will come at substantial cost to some countries driven by differences in cost of labor, electricity, and capital, as well as profit margins and overhead. Analysis assumes each player manufactures polysilicon, ingot/wafter, cell, and module for an integrated supply chain. Error bars assume higher and lower costs for manufacturing inputs. Assumptions about the type of technology for manufacturing are Siemens hydrochlorination (polysilicon), monocrystalline Cz and M2 size (ingot/wafer), PERC (cell), and 310 W, 60-cell (module). Interest burdens for India and Brazil are 5% and 9%, respectively, and 0% for all others. Source: Author’s analysis based on methods of Woodhouse et al. (2020) and Shiradkar et al. (2022).
Diversified international solar PV manufacturing will incur costs, but less than fully domestic supply chains
Reducing current concentrated solar PV manufacturing away from China and Southeast Asia to more diffuse manufacturing across Brazil, India, Germany, Taiwan, South Korea, or the United States will come at a substantial cost (Figure 4). The median cost of solar PV supply chains exclusively in regions outside China and Southeast Asia is 27% higher than those exclusively in China or Southeast Asia: $0.53/W versus $0.42/W. There is also more uncertainty in costs of these more widely distributed supply chains because they span more economies with a wider range of labor, capital, and energy costs. However, the lower range of costs for these diffused supply chains are largely in the United States, India, South Korea, and Taiwan.
Figure 4. The costs of diversified solar supply chains

There is a substantial difference in solar PV manufacturing costs between concentrated supply chains in China and Southeast Asia and potential diffuse manufacturing in other regions. Each distribution shows the costs of manufacturing exclusively located in those countries. Source: Author’s analysis.
Labor cost and interest burden influence the relative cost of diffuse solar PV supply chains
Figure 5. The sensitivity of final estimated costs to input costs

The cost difference (final module cost) between concentrated and diffuse solar PV supply chains is sensitive to labor costs, interest burden, and electricity cost. Costs are final module cost. Labor costs, interest burden, and electricity cost were increased and decreased by 50% respectively for all economies to estimate cost differences between diffuse and concentrated supply chains. Source: Author’s analysis.
The factors that influence the cost of diffused solar PV manufacturing supply chains relative to concentrated ones in China and Southeast Asia are first labor cost and then interest burden.
Here the interest burden represents a potential increase in the cost of capital for investment. Cost differences are relatively insensitive to electricity cost (Figure 5). Concentrated supply chains in China and Southeast Asia are cost competitive relative to other regions due to reduced labor costs. Hypothetically reducing labor costs uniformly across all economies by half reduces the gap in estimated cost between concentrated and diffuse solar PV manufacturing to less than 20%. Likewise, reducing the interest burden in India or Brazil by half also reduces the gap, but to a lesser extent to merely 24%. Repeating the same exercise for electricity costs shows the cost gap stays about the same for differences. However, these estimates are differences in costs of final modules, implicitly incorporating costs from preceding steps of the solar PV supply chain (Figure 1). Costs of individual steps, namely polysilicon and ingots/wafers, are more sensitive to electricity prices.
Conclusion: The Case for further International Cooperation, and its Limitations
Economies looking to reduce concentration or remove dependencies on China and associated Chinese investment in Southeast Asia must cooperate to minimize increased costs of diffuse solar manufacturing supply chains. These diffuse supply chains will cost approximately 30% more than current concentrated supply chains, but there is wide uncertainty in the increased cost. These supply chains could cost 13-70% more due to variations in each player producing each step of the solar PV manufacturing supply chain. Policymakers must consider these increased costs as a tradeoff to increase resilience through diversity; however, higher costs may dampen the pace of solar energy uptake, induce job losses, and consequently slow decarbonization to meet climate goals in the short-term.
Manufacturing subsidies or import tariffs offered by governments can reduce cost gaps between concentrated and ensure dispersed supply chains. However, in practice, this means high-income countries like the United States, Germany, South Korea, or Taiwan, must work with middle-income countries like India or Brazil to coordinate finance, subsidies, incentives, and trade barriers for solar PV manufacturing. While cooperation with Southeast Asian countries like Malaysia or Philippines is possible, Chinese economic influence in the region is high, providing a barrier to such efforts. Cooperation allows countries to take advantage of labor cost differences while achieving scale, increasing resilience, and exchanging of technical knowhow and innovation. Likewise, given the impact of interest burdens on emerging economies, access to cheaper financing to reduce the cost of capital will also be key to reducing the costs associated with diversified supply chains, especially because initial investment costs to set up solar PV manufacturing are generally higher outside China and Southeast Asia. Further cooperation between countries also reduces uncertainty in costs by demonstrating viable alternative supply chains, even if such supply chains are only viable after subsidies or financial incentives. Lastly, cooperation minimizes the possibility of further trade barriers amongst countries looking to diversify the solar PV supply chain. Trade barriers like tariffs would increase solar PV costs, as they have in the United States.
Several economies have offered subsidies to reduce domestic manufacturing costs like the Inflation Reduction Act in the United States and the Production Linked Incentive in India. These likely reduce costs to make domestically manufactured solar PV cost competitive. However, while new manufacturing capacity has been announced after these incentives, China also plans to expand solar PV manufacturing capacity at a faster rate. This could potentially induce a supply glut by increasing present manufacturing overcapacity, reducing prices, and causing cancellation of planned manufacturing expansions by 2027. Consequently, this furthers the case of international cooperation to avoid both misallocated private investment and public subsidies which are limited for all but high-income countries. Overall, this reduces market uncertainty to expand manufacturing capacity to realize diffuse, less vulnerable supply chains.
This analysis acknowledges several limitations and uncertainties. It estimates short-term unit unsubsidized costs based on currently prevailing solar PV technologies using 2018 values, ignoring manufacturing incentives or trade barriers. Newer technologies or efficiencies, the result of research, development, and innovation, have decreased estimated costs for 2022 and 2023, as shown by updated cost analysis from the International Energy Agency. Relative cost differences between economies likely still hold true from this analysis because costs are sensitive to relative differences in labor costs, interest burden, and electricity costs between economies. These are similar between 2018 and 2022-2023. For example, advanced cell designs will see an increase in market shares which would require different assumptions for manufacturing cost like materials and initial investment costs. Likewise, unsubsidized costs are on a per watt of produced solar PV basis, which does not factor in total supply and demand. Extrapolating to a total market basis accounting for subsidies and tariffs imposed by national governments would allow a more comprehensive picture of the genuine cost of diffuse solar PV supply chains. It remains to be seen how such subsidies and tariffs between countries will interact at the global market level to drive actual investment decisions and associated prices. Lastly, this brief uses different economies to model representative supply chains that reflect current concentration in certain geographies or future hypothetical dispersion to other geographies. It does not consider geopolitical actions that might either encourage or hinder such supply chain reorientation.
ACKNOWLEDGEMENTS
The author acknowledges helpful comments from Medha Prasanna to frame the paper, data from Juzer Vasi and Narendra Shiradkar, and reviewer comments from Alexander Hogeveen-Rutter and Brittany L. Smith.
This paper is part of ORF America’s G20 initiative supported by the Children’s Investment Fund Foundation (CIFF). This background paper reflects the personal research, analysis, and views of the authors, and does not represent the position of either of these institutions, their affiliates, or partners.
Note: The footnotes can be found in the PDF file.